Types of Charts in Excel
How to Change Chart Types in Excel

Excel Training Features:
-
Interactive bite-sized lessons
-
Get Certified
-
Accurate skill assessments
-
Customizable, LMS-ready content

Different types of charts are better for presenting different types of information. For example, a column chart is great for comparing values of different items, but not for illustrating trends or relationships. If you find that a chart you’ve created isn’t the best fit for your data, you can switch to a different chart type.
Change the Chart Type
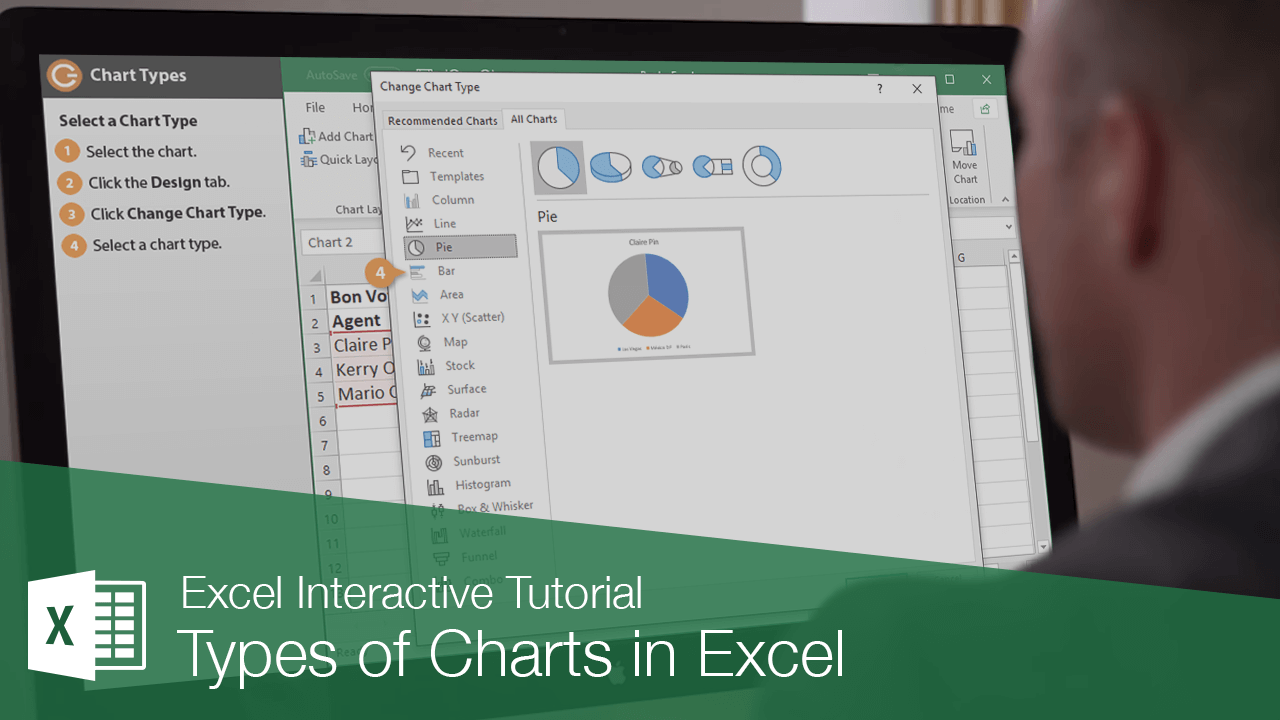
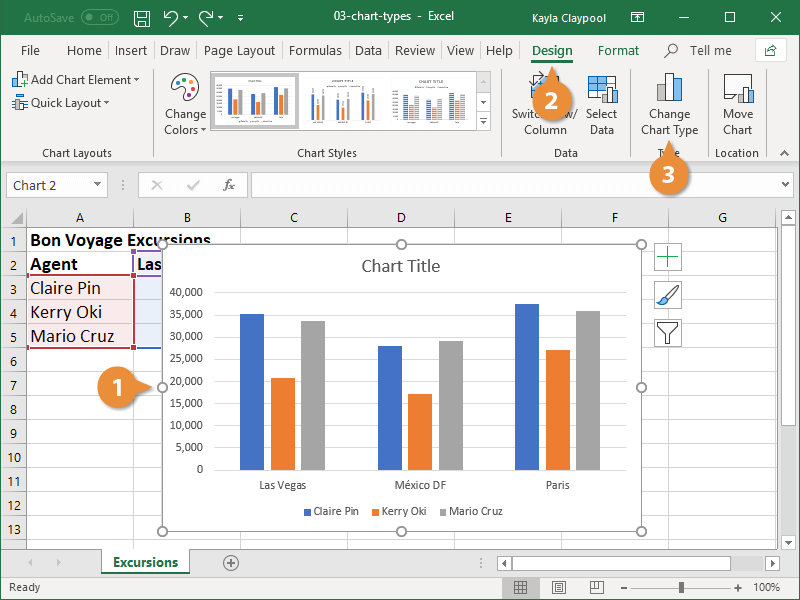
- Select the chart you want to change.
- Click the Design tab.
- Click Change Chart Type.
Right-click a chart and select Change Chart Type from the menu.
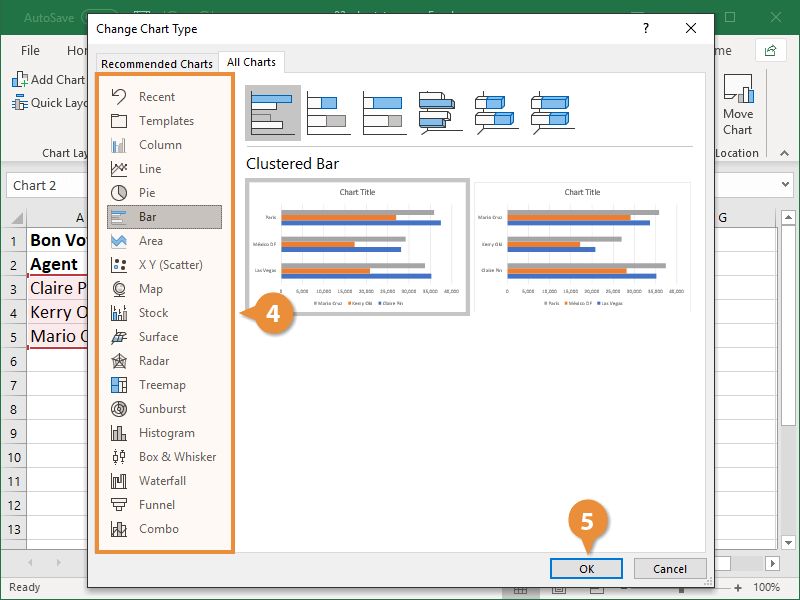
The Change Chart Type dialog box appears. It shows the different types of charts available.
- Select a different chart option.
- Click OK.
Switch Row/Column Data
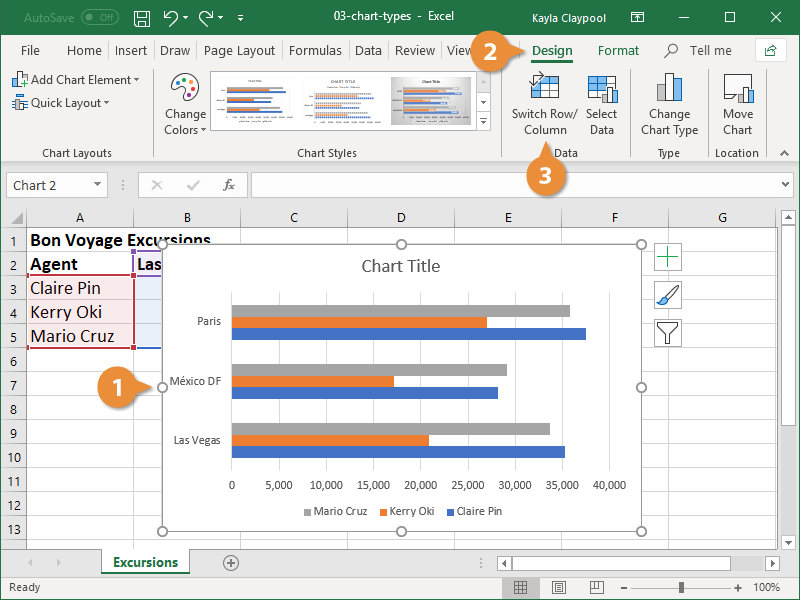
You can switch the rows and columns of data in a chart so they appear in opposite positions.
- Select the chart
- Click the Design tab.
- Click the Switch Row/Column button.

FREE Quick Reference
Click to DownloadFree to distribute with our compliments; we hope you will consider our paid training.
- LinkedIn-ready certificate
- Skill assessments
- Bite-sized, interactive lessons
- Saved progress