Quick Analysis Tool in Excel

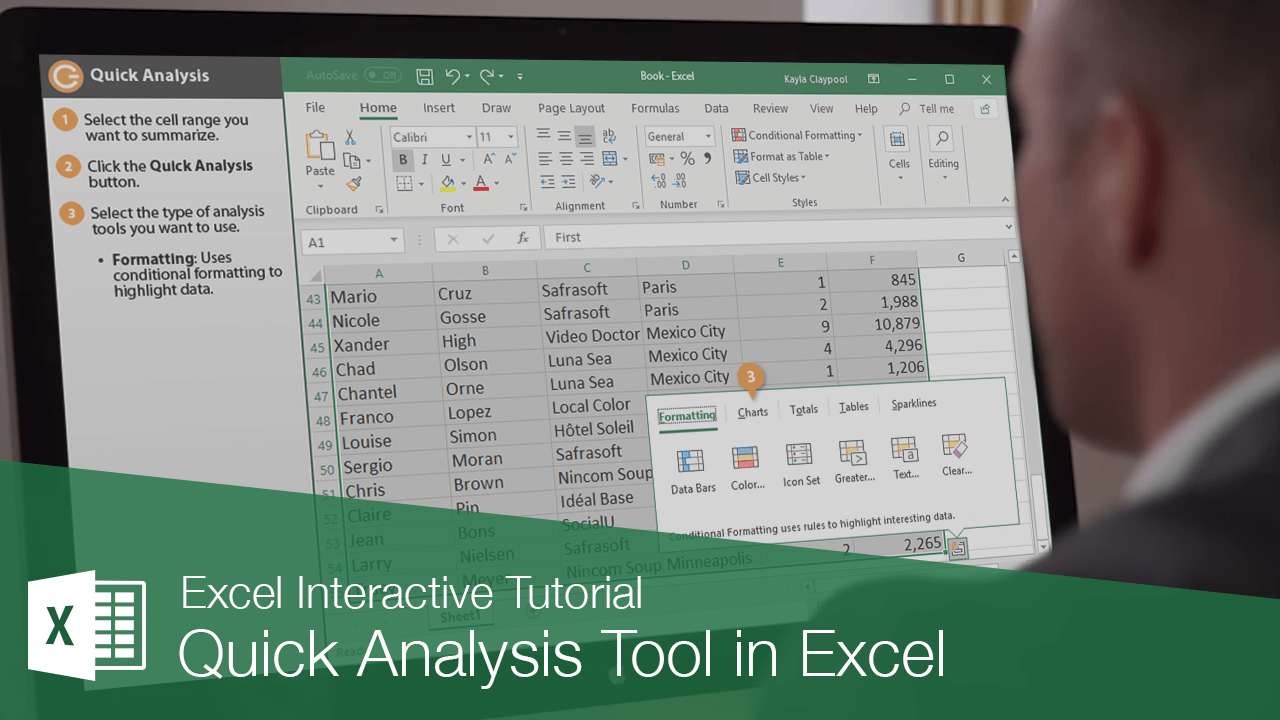
The Quick Analysis tool helps you quickly format your data into a chart, table, or sparkline.

Excel Training

Excel Training Features:

  • Interactive bite-sized lessons

  • Get Certified

  • Accurate skill assessments

  • Customizable, LMS-ready content

Prices
Users love us
4.9 stars out of 5 on G2

4.9 out of 5 on G2

Quick Analysis Tool in Excel

The Quick Analysis function helps you quickly format your data into a chart, table, summary formula, sparkline, or highlighted figures with just a few simple steps.

Use the Quick Analysis Button

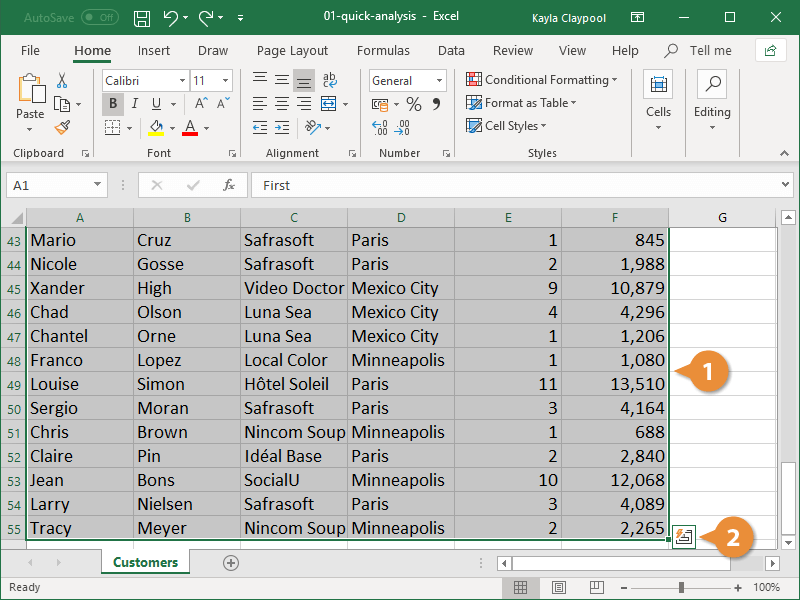
  1. Select the cell range you want to summarize.
    Quick Analysis

    Be careful when selecting your data. The Quick Analysis button will not appear when using the Ctrl key to make multiple selections.

  2. Click the Quick Analysis button.
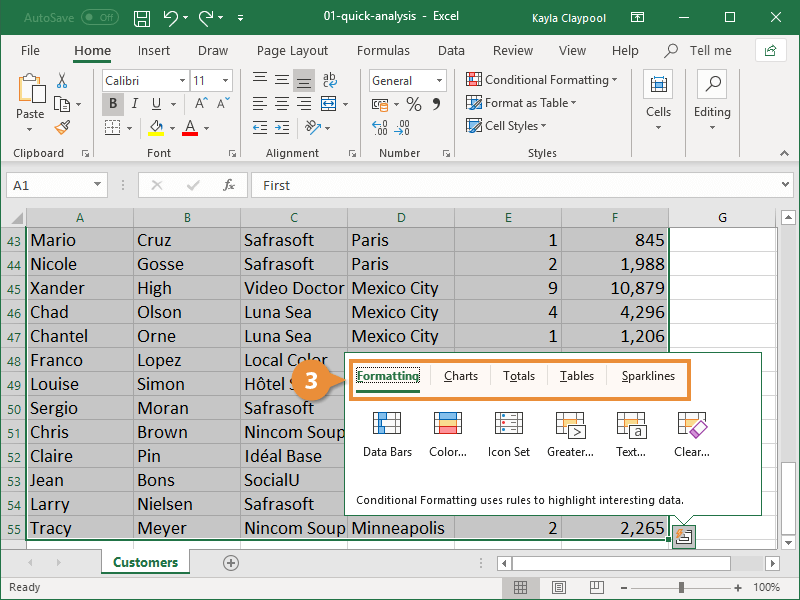
  3. Select the type of analysis tools you want to use.
    Quick Analysis
    • Formatting: Highlight data using conditional formatting.
    • Charts: Chart the selected data.
    • Totals: Create common summary formulas.
    • Tables: Summarize data in a table or PivotTable.
    • Sparklines: Mini charts placed in single cells.