Change Chart Style in Excel

How to Apply Chart Layouts and Styles in Excel

Excel Training

Excel Training Features:

  • Interactive bite-sized lessons

  • Get Certified

  • Accurate skill assessments

  • Customizable, LMS-ready content

Prices
Users love us
4.9 stars out of 5 on G2

4.9 out of 5 on G2

Change Chart Style in Excel

An easy way to change the look and feel of a chart is by applying one of the built-in layouts or styles that are available in Excel.

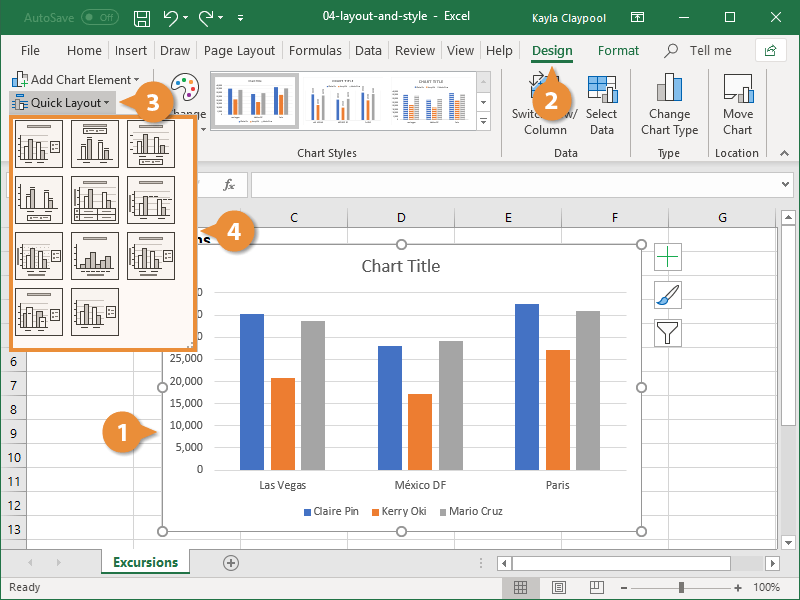
Apply a Chart Layout

Built-in chart layouts can quickly adjust the overall layout of a chart with different combinations of titles, labels, and chart orientations.

  1. Select the chart you want to format.
  2. Click the Design tab.
  3. Click the Quick Layout button.
  4. Select the layout you want to use.
    Layout and Style

The selected layout is applied to the chart.

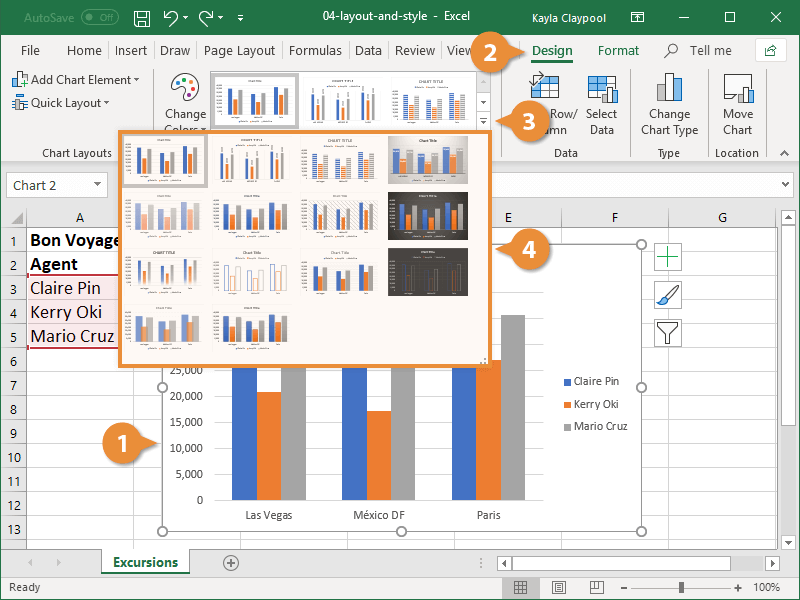
Apply a Chart Style

Built-in chart styles allow you to adjust the format of several chart elements all at once. Styles quickly change colors, shading, and other formatting properties.

  1. Select the chart
  2. Click the Design tab.
  3. Click the Chart Styles More button.

    If the style you want to use is already displayed in the gallery, there is no need to expand the menu, just select it.

  4. Select a new style.
    Layout and Style

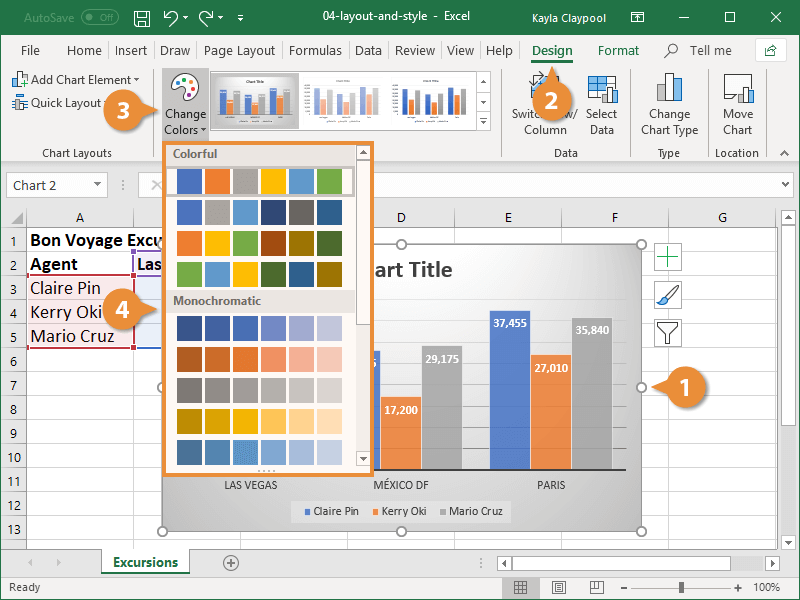
Change Colors

You can maintain the general look of a style while updating just the colors to better suit your needs.

  1. Select the chart
  2. Click the Design tab.
  3. Click the Change Colors button.
  4. Select a new color set.
    Layout and Style

The new color set is applied to the chart.